The state of vibe-coded app security (549 repos)
Based on 549 repos · published 16 July 2026 · by O Grover, founder, ogbuilds
the numbers
| figure | what it measures |
|---|---|
| 20.4% | had at least one exposed-secret finding (~1 in 5) |
| 26.8% | had at least one critical or high security finding |
| 14.9% | had at least one critical finding |
| 47.5% | had at least one injection-category finding (2nd most-hit category) |
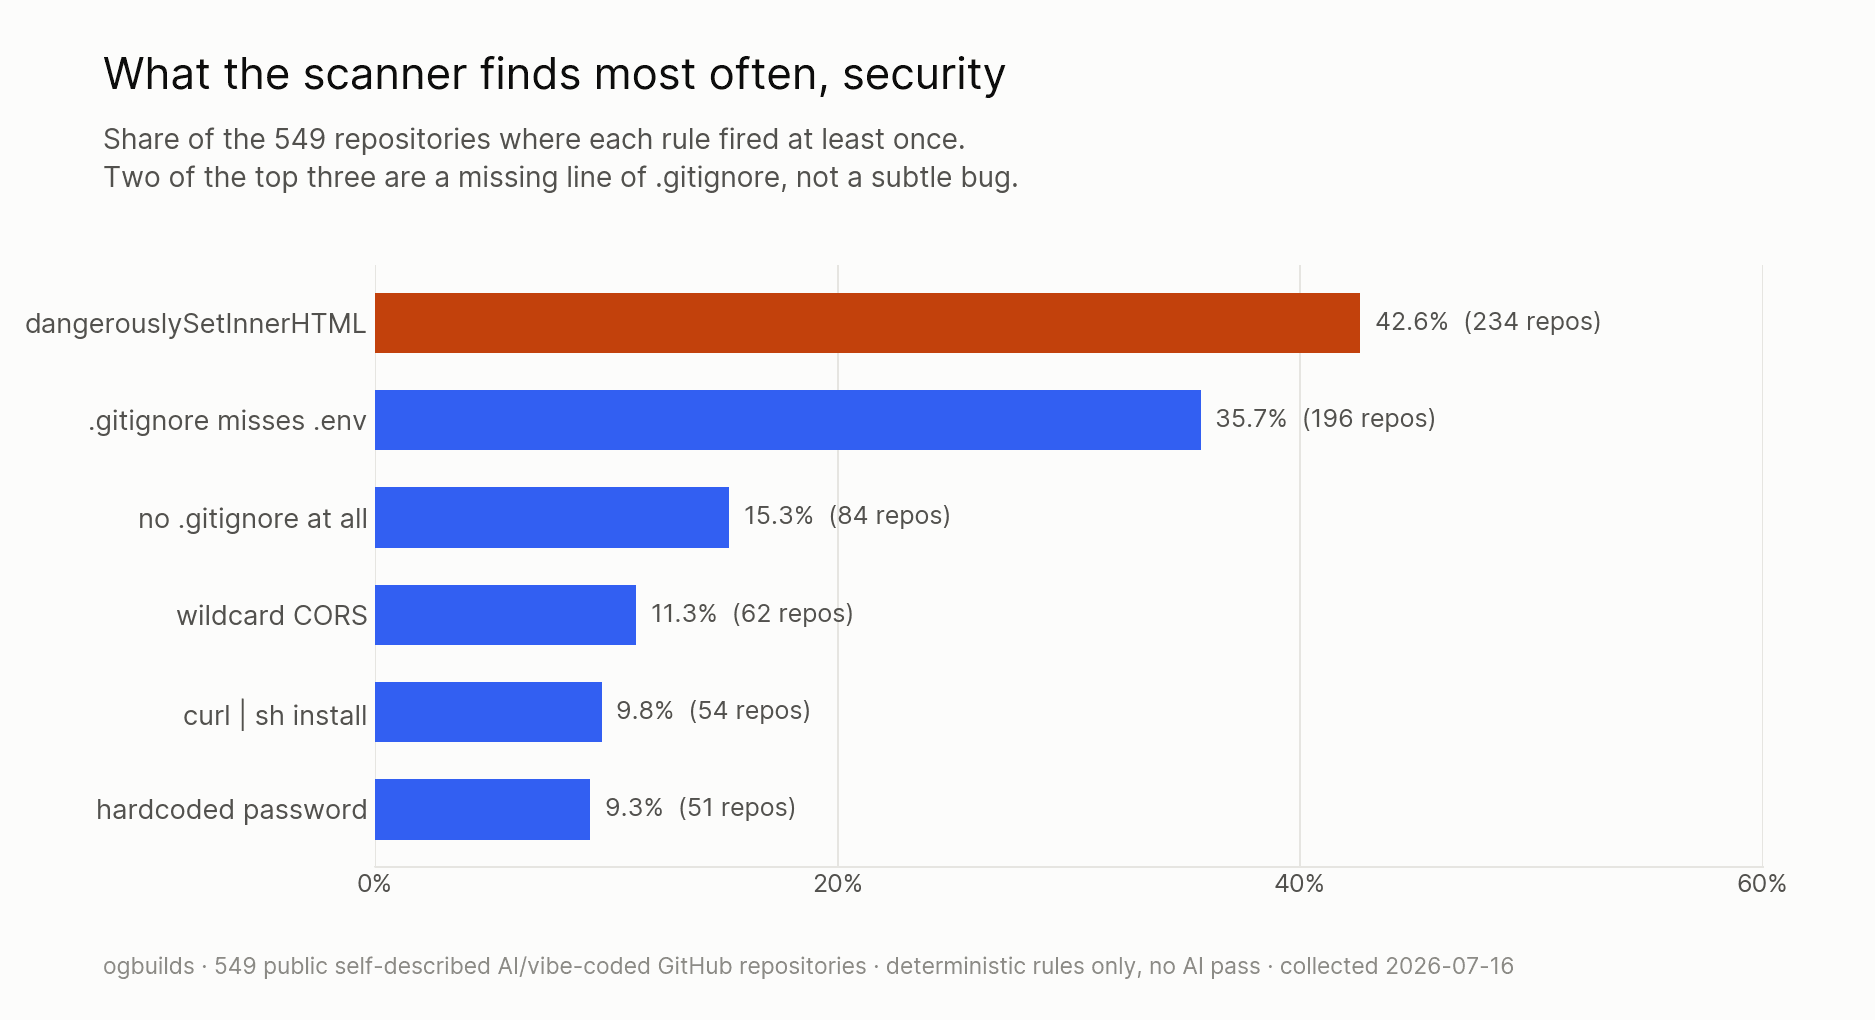
| 42.6% | used dangerouslySetInnerHTML, the single most common finding |
| 97 / 89.0 | median score (an A) vs mean of 89.0. The median is inflated by tiny demo repos; 196 of 549 scored below A, including 14 at F |
the same numbers, minus the toy repos (n = 467)
The stricter cut: repos with 15 or more scannable files, which drops workshop demos and one-page toys. These are the numbers the pitch leads with.
| 23.3% | had at least one exposed-secret finding (~1 in 4) |
| 30.2% | had at least one critical or high security finding (~1 in 3) |
| 48.8% | had at least one injection-category finding |
| 43.0% | used dangerouslySetInnerHTML |
the shape of the data
Charts are free to reuse with a link back to this page.
methodology
quality·vibes (formerly secure·vibes) heuristic rules engine (no AI pass) run over 549 public GitHub repos that describe themselves as AI- or vibe-coded. The original 107-repo set from June 2026 grew to 577 candidates in July 2026.
Corpus selection: repos whose name, description, or README says AI- or vibe-coded. We took them at their word and didn't verify provenance. 577 candidates, 28 skipped as too large or unreachable, n = 549 analyzed.
Reporting caps at 10 findings per rule and 300 per repo, so counts for the messiest repos are floors. The Claude review that runs in a normal quality·vibes scan was off. Every number here is deterministic and re-runnable.
The downloadable per-repo rows carry anonymised repo IDs. These are public GitHub repos, and a file mapping named repos to their security findings would be a target list, so that join stays unpublished.
the same 549 repos, scored for mess
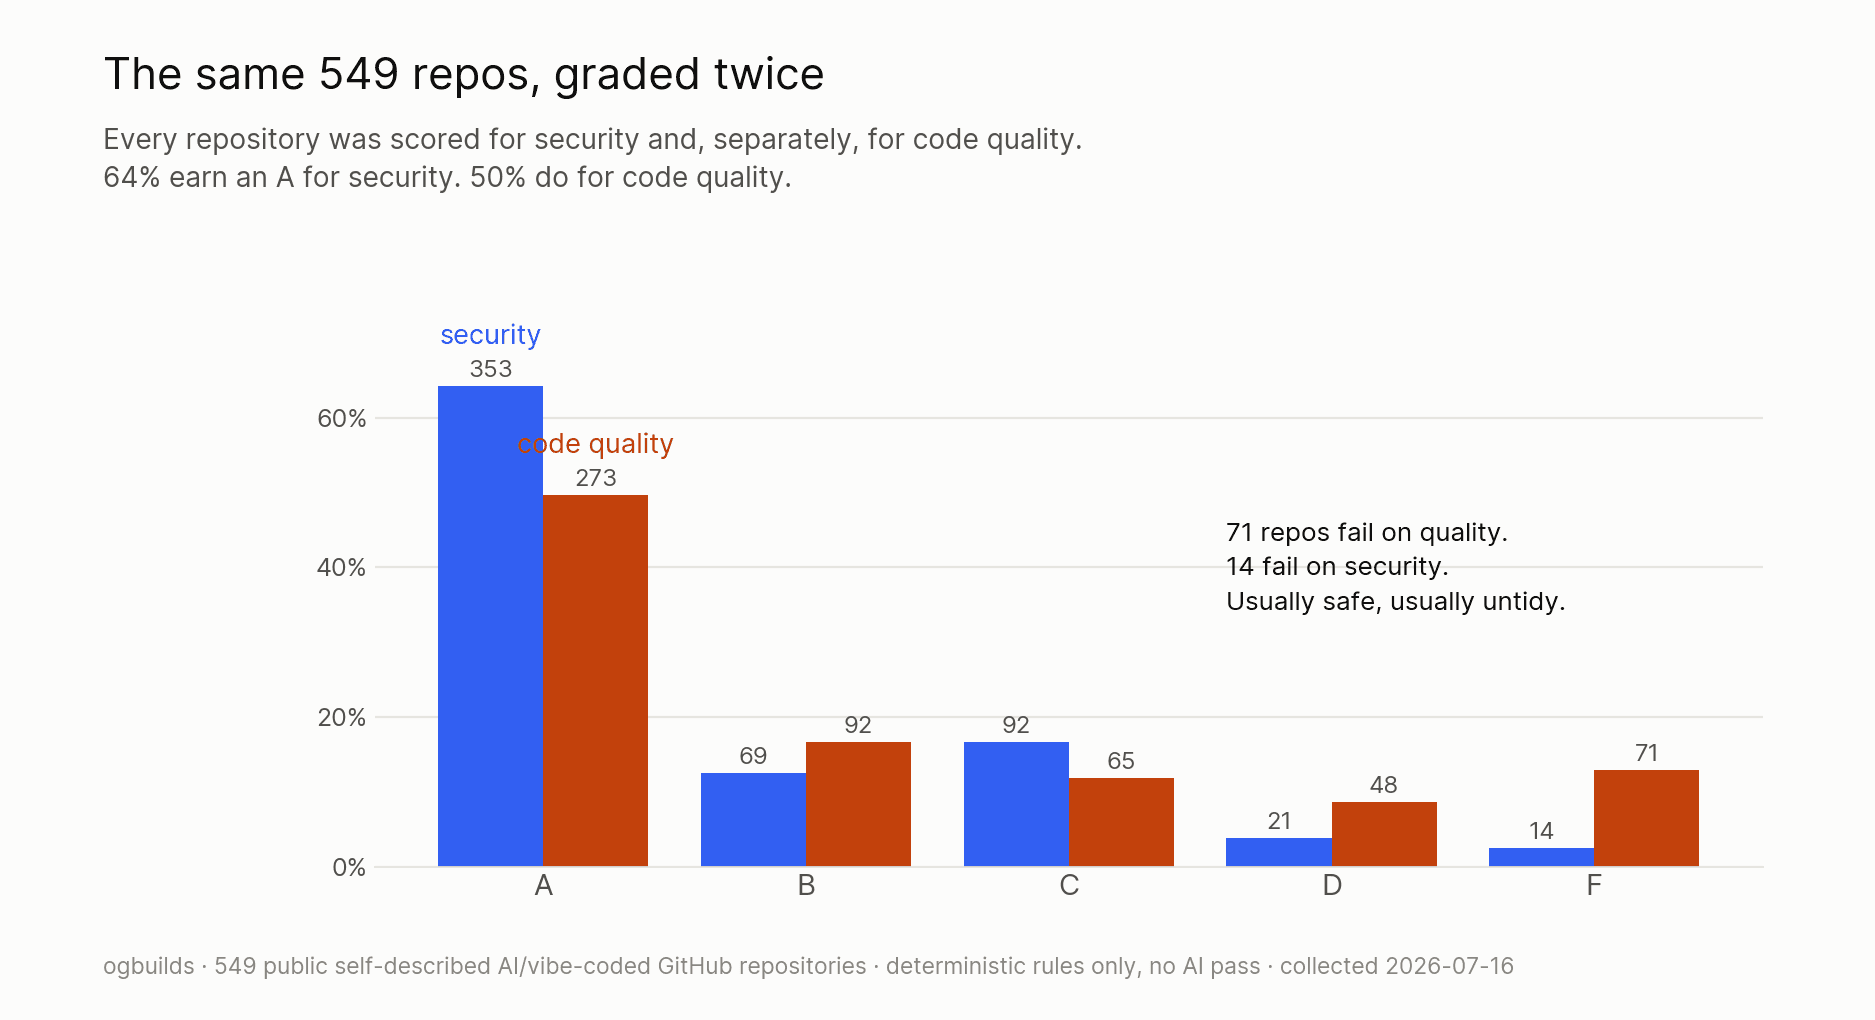
Both engines ran over one set of repos, so the two datasets join row for row. 71 bottomed out at F on cleanliness against 14 here. Messy code is far more common than vulnerable code, and it's what you hit first.
The state of vibe-coded code quality (549 repos) →download the raw data
Don't take our word for it. Every figure on this page recomputes from these files.
free, no signup. one ask before the links: cite this page.