The state of vibe-coded code quality (549 repos)
Based on 549 repos · published 16 July 2026 · by O Grover, founder, ogbuilds
the numbers
| figure | what it measures |
|---|---|
| 63.2% | had dead code left in |
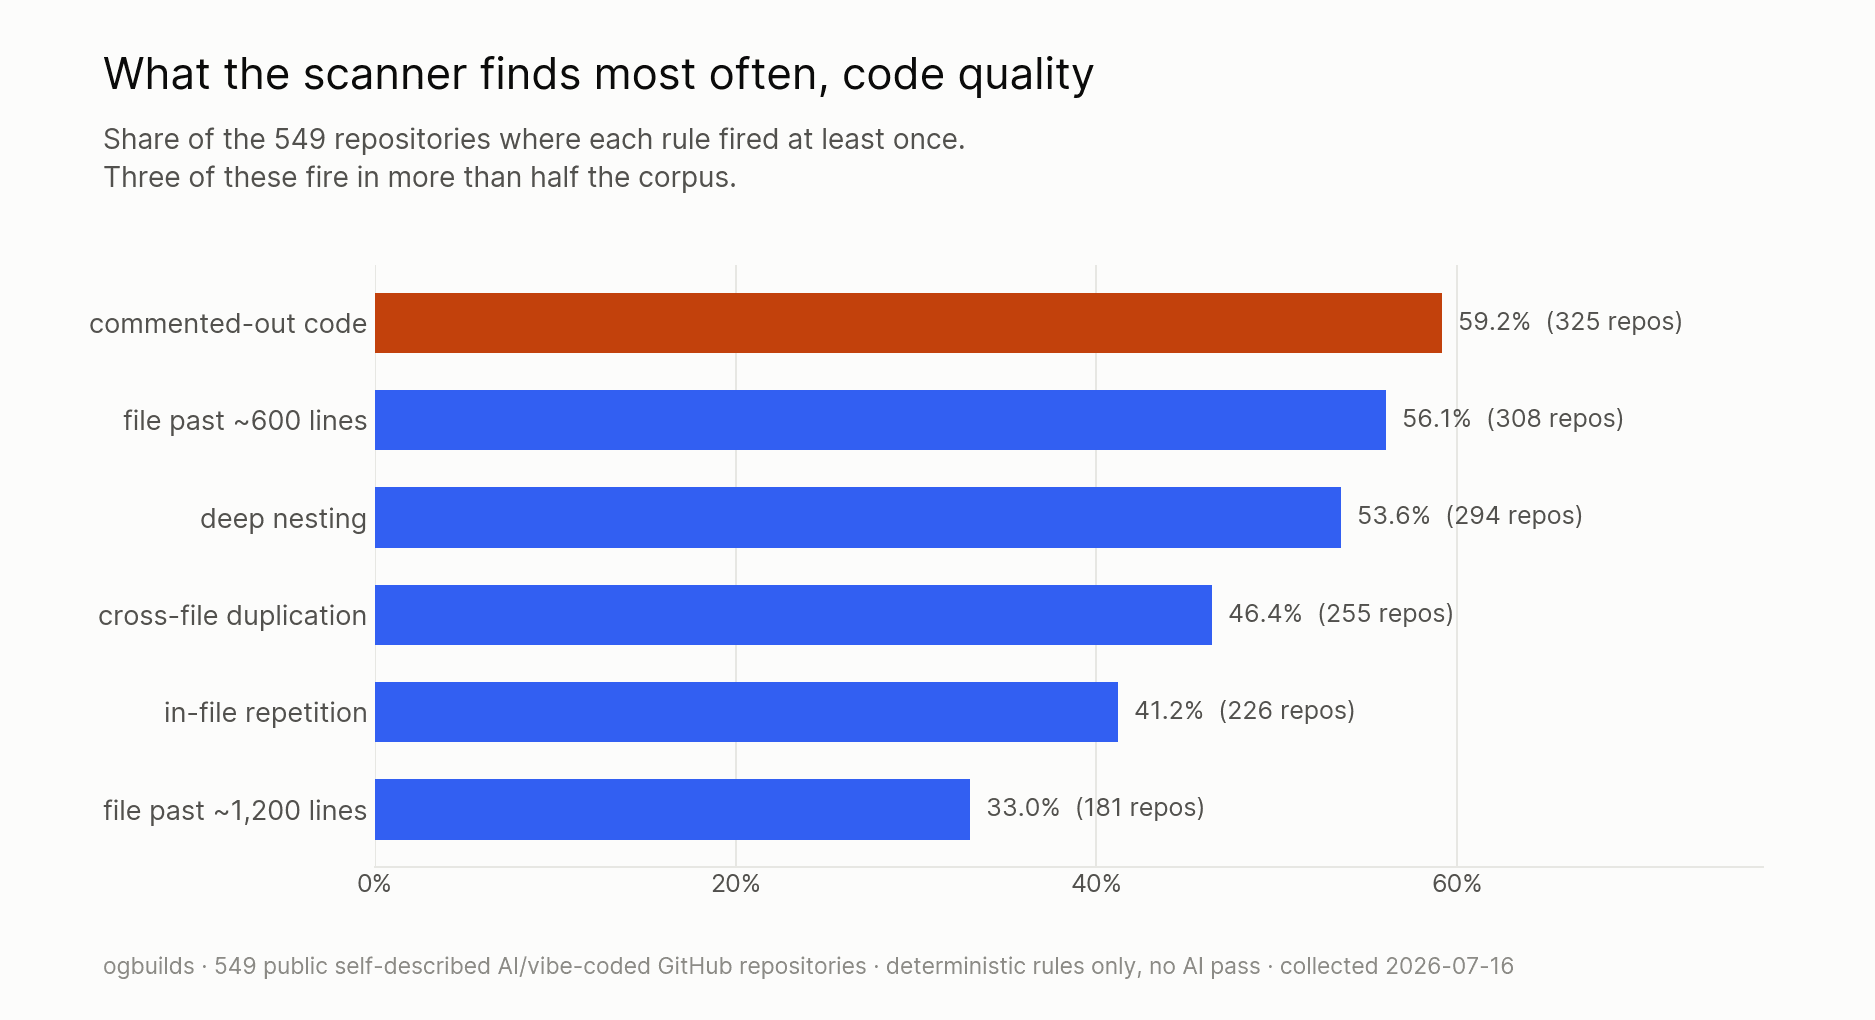
| 60.5% | had files past the ~600-line threshold |
| 59.2% | contained commented-out code |
| 55.6% | had duplicated logic |
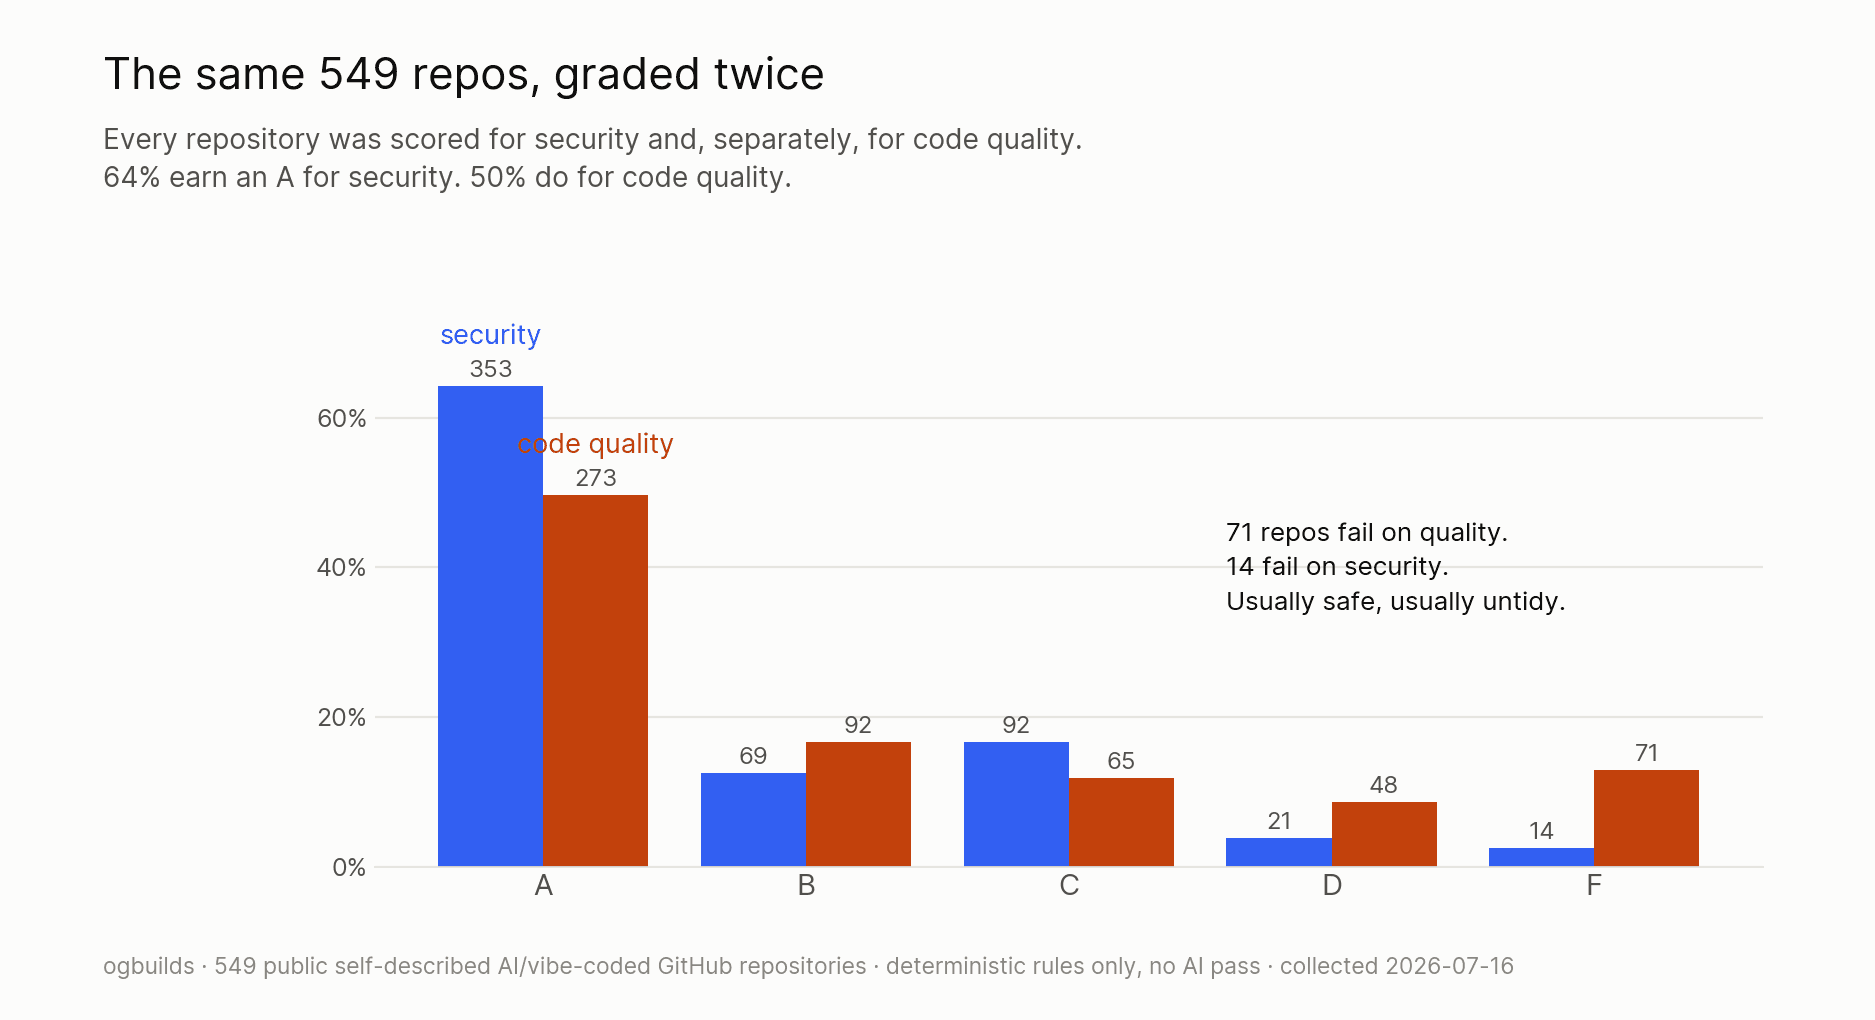
| 89 / 80.7 | median score (a B) vs mean of 80.7. The distribution is bimodal: tiny demo repos inflate the median while 71 of 549 graded F |
the same numbers, minus the toy repos (n = 467)
Repos with 15+ scannable files only, so workshop demos and single-page toys don't count. It's the cut the pitch numbers come from.
| 70% | had dead code left in |
| 66% | contained commented-out code |
| 63% | had duplicated logic |
| 42.6% | had at least one critical or high cleanliness finding |
the shape of the data
Charts are free to reuse with a link back to this page.
methodology
quality·vibes (formerly clean·vibes) heuristic rules engine run over the same 549 public AI/vibe-coded GitHub repos. The June 2026 set grew to 577 candidates in July 2026.
Same corpus and selection rules as the security study: 577 candidates that call themselves AI- or vibe-coded, 28 skipped, n = 549 analyzed. We took the self-description at face value.
Per-rule reporting caps at 10 findings (300 per repo), so the messiest repos' counts are floors. The Claude review in a normal clean·vibes scan was off. Deterministic rules only, re-runnable.
The downloadable per-repo rows carry anonymised repo IDs, shared with the security study's rows. The two files join to each other, not to named repos.
what a security scanner made of the same repos
One set of repos, two engines. Only 14 graded F for security against 71 here, so that tail is thinner. It's sharper, though: 20.4% had a key or token sitting in the source.
The state of vibe-coded app security (549 repos) →download the raw data
Don't take our word for it. Every figure on this page recomputes from these files.
free, no signup. one ask before the links: cite this page.