What 1,969 Lovable apps actually ship
Based on 1,969 apps · published 8 August 2026 · by O Grover, founder, ogbuilds
the numbers
| figure | what it measures |
|---|---|
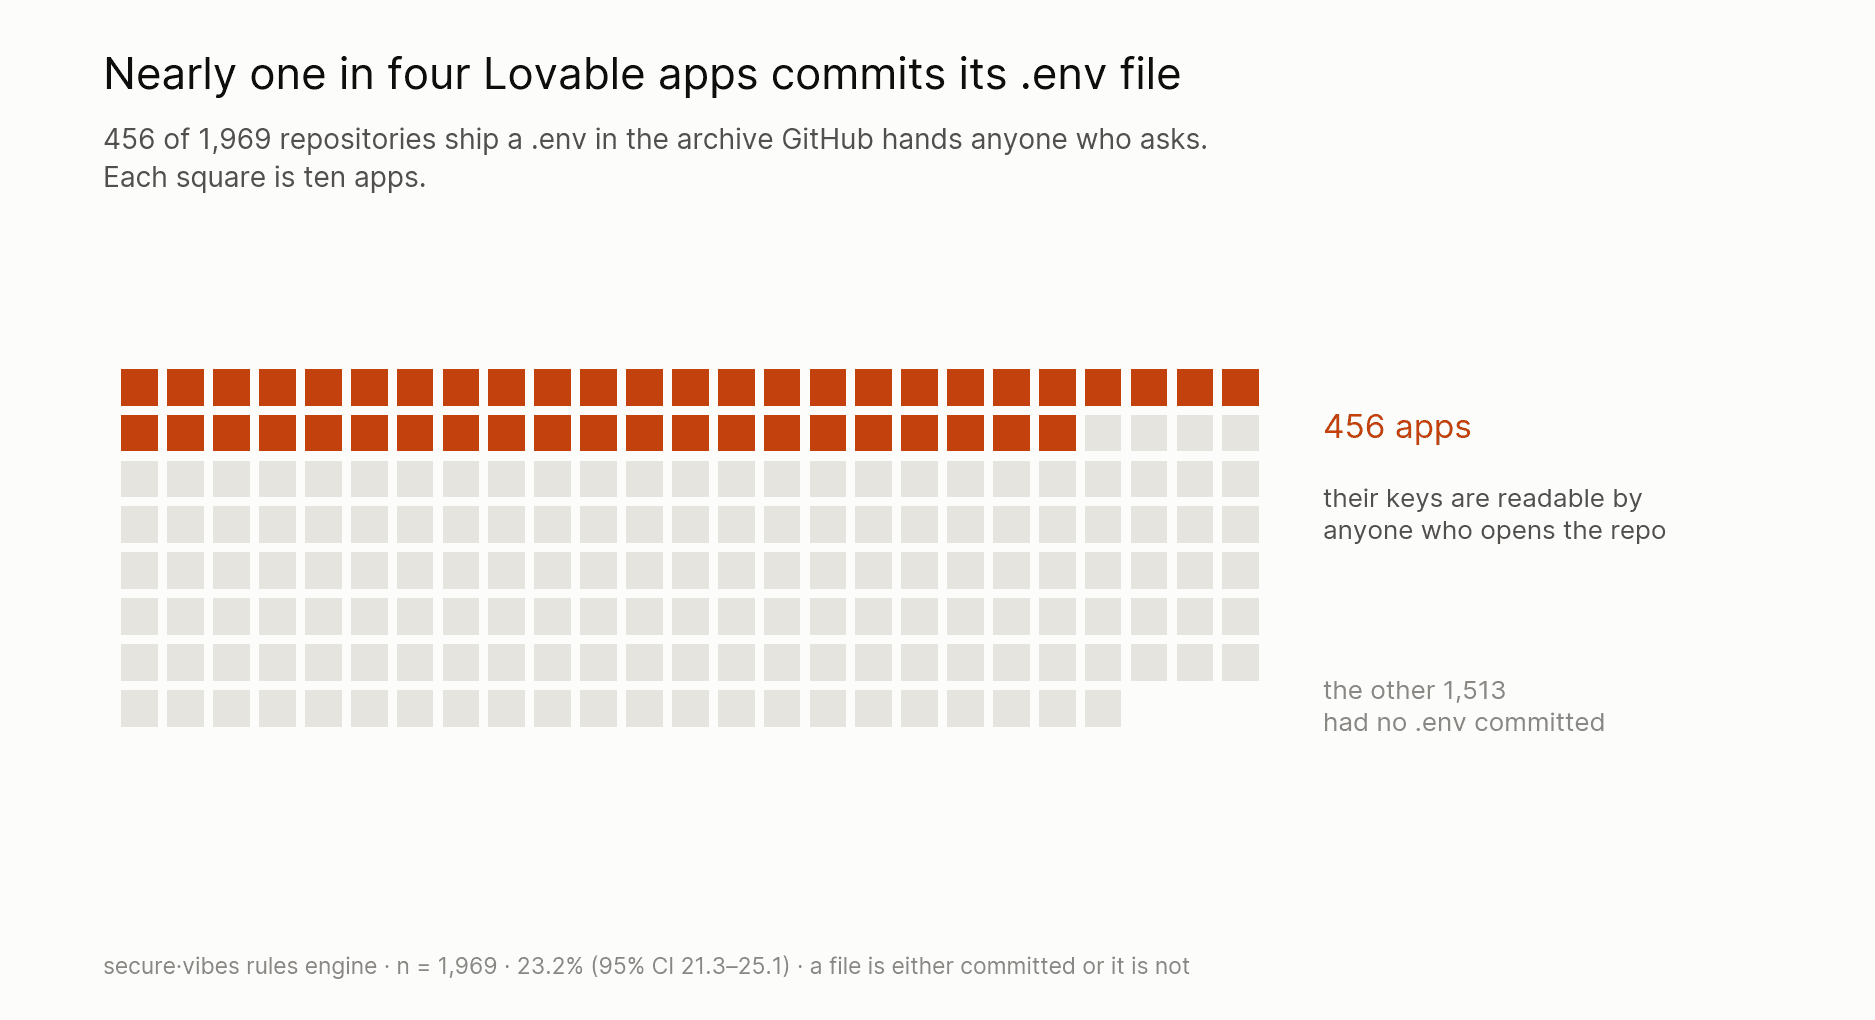
| 23.2% | commit a .env file to the repository (~1 in 4). a file is either in the archive or it is not, so this is the most durable figure here. it measures presence, not exploitability: see the note below on why a Lovable .env often holds values that are public by design |
| 42.2% | trip a hardcoded-credential rule for a jwt, password, connection string or api key. an UPPER BOUND, not a count: see the note below on what a second pass does to these |
| 38.3% | carry at least one critical or high finding. partly built on the credential rules above, so it inherits the same ceiling |
| 2.6% | come back with nothing found at all. a clean Lovable app is the exception, not the rule |
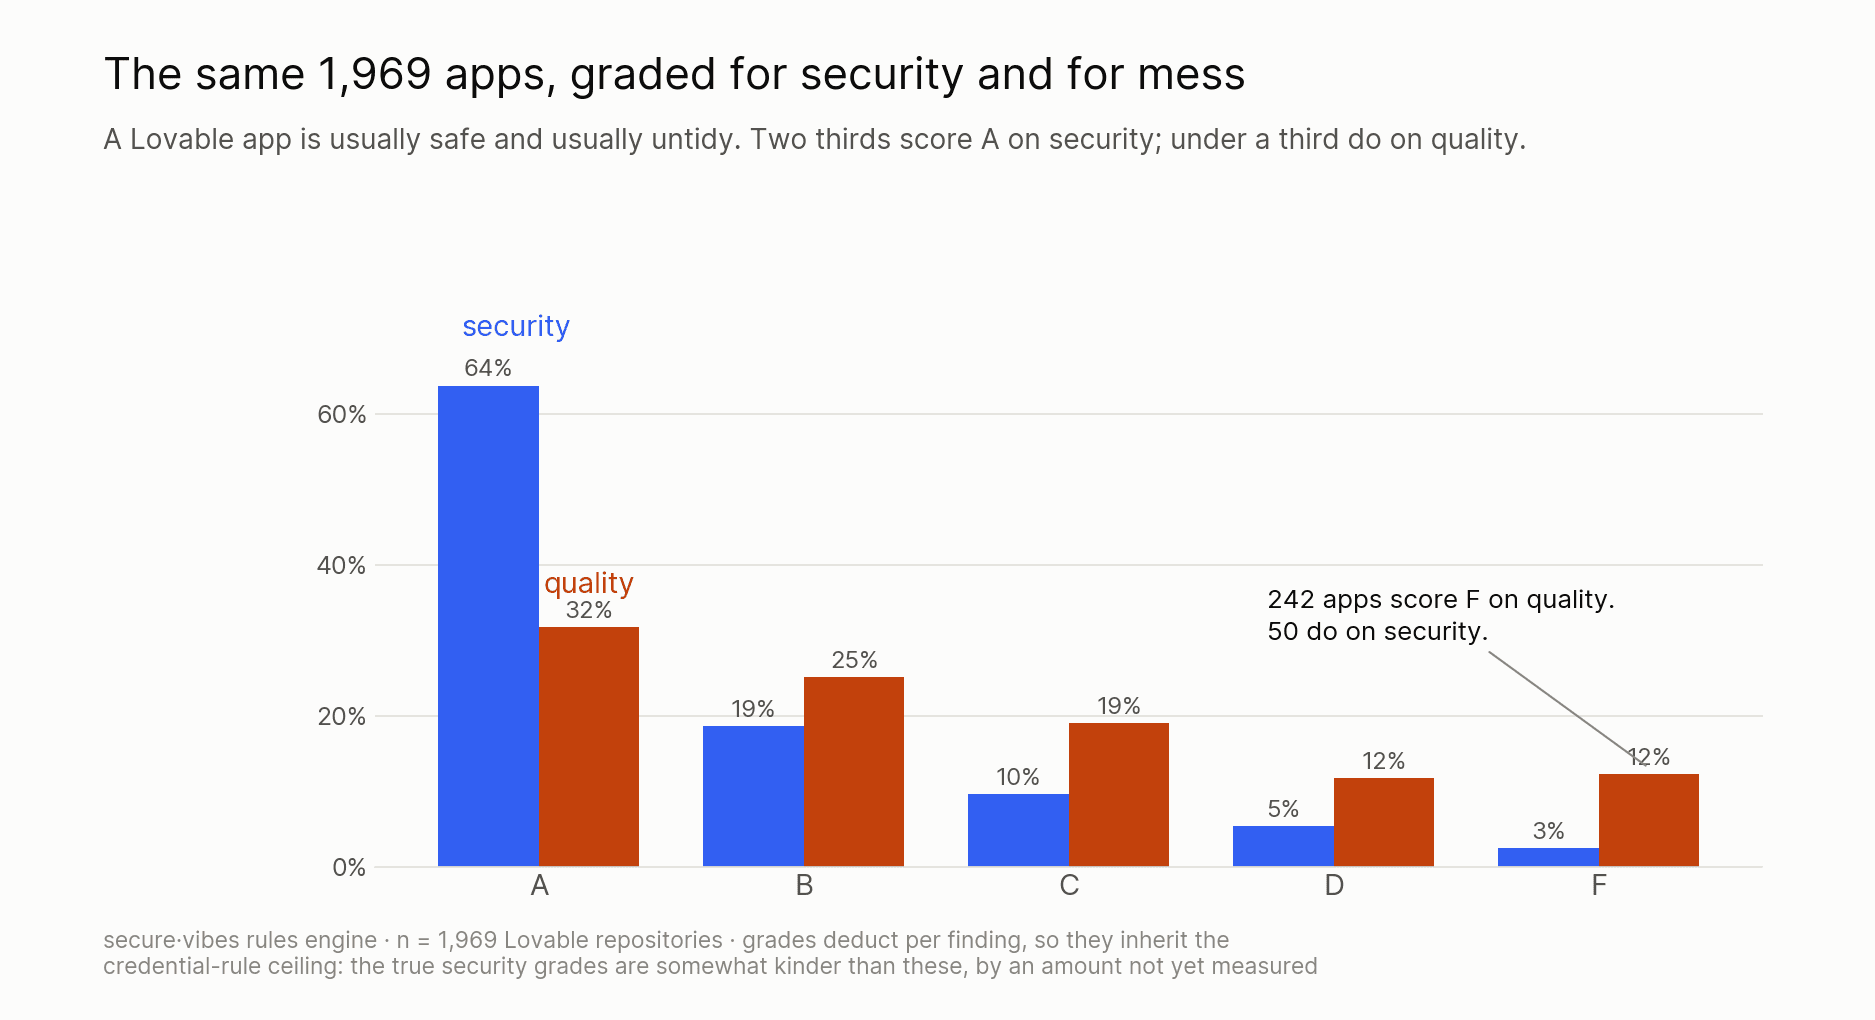
| 94 / 83 | median security score against median code-quality score. the apps are broadly safe and considerably messier |
If you built with Lovable, the scan below is the same engine that produced these numbers, and it takes about a minute.
the shape of the data
Charts are free to reuse with a link back to this page.
methodology
quality·vibes (formerly secure·vibes) rules engine (no AI pass) run over 1,969 public GitHub repositories built with Lovable, identified by the lovable-tagger vite plugin in package.json, which Lovable writes into every project it generates. Sampled from a 5,286-repo frame in a fixed seeded order, so a larger run is a superset of this one.
Every proportion carries a 95% Wilson confidence interval in the aggregates file. A percentage from a sample without one invites the reader to treat it as exact.
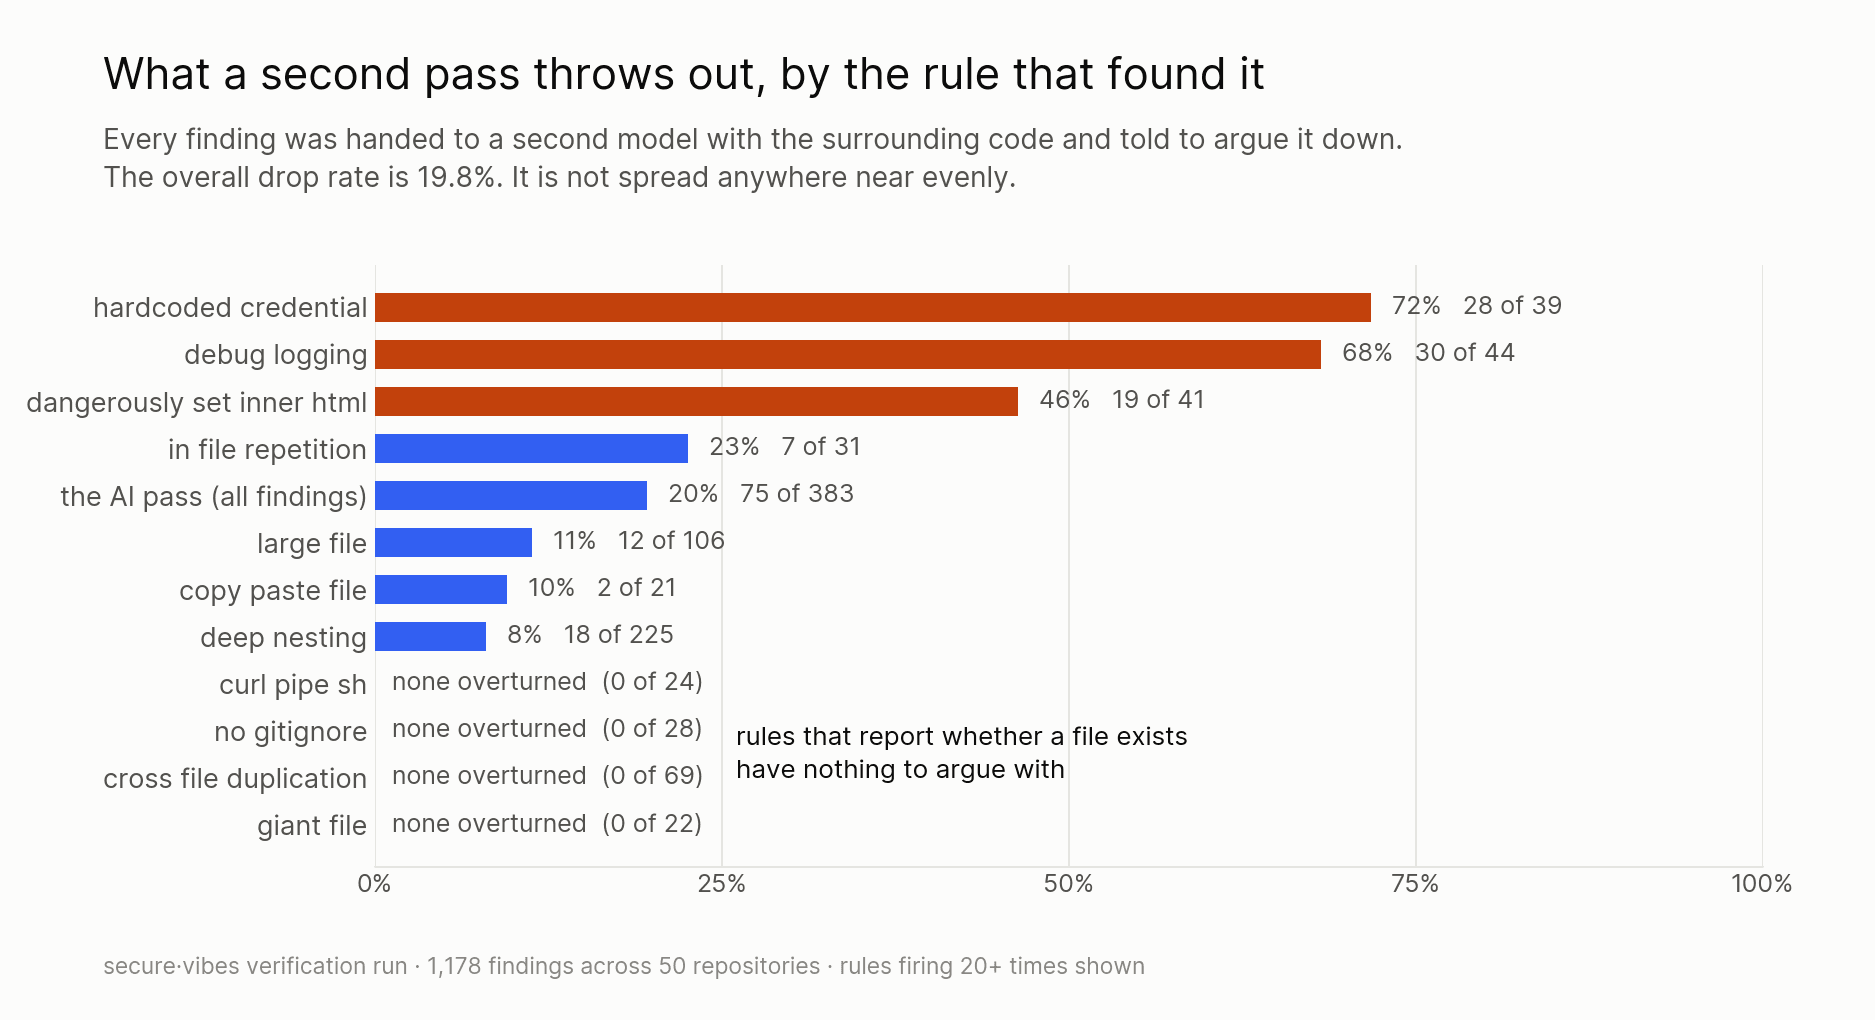
How we know that. A separate adversarial pass was run over 50 of these repositories (25 Lovable, 25 from the 549-repo corpus): rules engine, then Claude Haiku, then Claude Opus 5 adjudicating all 1,178 resulting findings one at a time with the surrounding code in front of it, at a 360,000-character budget against the 60,000 the analysis had. It dropped 19.8% of findings with high confidence, 19.7% on the Lovable half and 19.9% on the other, and cost $11.94. Only high-confidence rejections count as drops; counting every disputed finding would put it near 48%. Both raw files are below.
The drops are not spread evenly, and that is the whole reason one figure above leads and the others carry a ceiling. Rules that report a file's existence lost nothing: 0 of 69 cross-file-duplication findings, 0 of 28 no-gitignore, 0 of 24 curl-pipe-sh, 0 of 22 giant-file. The pattern-matching credential rules lost 28 of 39.
Everything derived from a finding COUNT inherits that ceiling, not just the three percentages flagged below: the median scores, both grade distributions, and the 2.6% that came back clean. Scores deduct per finding, so over-reporting pushes them down. The honest reading is that these apps grade slightly better than shown, and that more than 2.6% are genuinely clean. The direction is certain; the size is not measured, and putting a number on it needs all 1,969 verified rather than 50 of them.
The credential figures are upper bounds and the .env figure is not, which is why only one of them leads. Running an adversarial second pass over a 50-repo subsample, 28 of 39 individual credential findings were overturned with high confidence, against 19.8% across all finding types. At repository level the damage is smaller, because a repo needs only one surviving finding to still count: 5 of 7 flagged Lovable repos kept one. That points at roughly 30% rather than 42.2%, on 7 repos, which is a direction and not a number worth printing as a headline. Verifying all 1,969 is the fix, and it has not been done. env-file-committed was adjudicated twice in that subsample, too few times to say anything about the 23.2%.
dangerouslySetInnerHTML appears in 85.5% of these repos and is deliberately kept out of every headline above. It is a Lovable template artifact: the generated shadcn chart component uses it for CSS injection. These are not 1,683 cross-site-scripting holes. It is medium severity and drives none of the figures here.
The download cap was raised from 40MB to 150MB for this run. At 40MB roughly a fifth of Lovable repositories are rejected as too large, and that fifth skews toward bigger apps, so reporting on the survivors would have described a filtered population. At 150MB the skip rate is 1.6% (31 of 2,000: 29 still too large, 2 network).
Forks are not excluded, so a widely-copied template and its copies can each appear. The sampling walks disjoint slices of package.json byte size, and coverage across those slices is uneven by an unknown amount, which could move the dependency figures, though not secrets or injection.
The stricter cut other corpus studies need (repositories with 15+ scannable files) changes almost nothing here: 1,565 of 1,582 qualify, because Lovable generates a whole application scaffold rather than a one-page demo.
A committed .env file is not the same thing as a leaked secret, and this study measures the first. Lovable generates Vite and Supabase applications, so a typical .env holds VITE_SUPABASE_URL and the anon key. Both are public by design: Vite compiles anything prefixed VITE_ into the browser bundle, and the anon key's access is bounded by row-level security rather than by secrecy. The severe cases are a service_role key, or a real secret given a VITE_ prefix so that it works, which publishes it to every visitor rather than merely to the repository. This run does not separate those, because the rows carry rule-level counts rather than matched values. Read 23.2% as file presence, not as a count of exploitable credentials.
Counts by credential class, recomputed from the published rows so anyone can check them: hardcoded jwt 489 repositories, committed .env 456, hardcoded password 317, database connection string 142, google api key 105, generic secret assignment 39, private key block 19, openai key 16, private key file 9. The classes whose severity nobody would argue about sit near 1%, and the large numbers are the ambiguous ones. That gap is the argument for reading this page by class rather than by headline.
The next run will carry a structural validation state per finding: public-by-design prefix, placeholder, or structurally valid secret. Most providers encode blast radius in the format, so this is readable without contacting anyone. A Supabase JWT is the clearest case, since its payload names its own role, and anon against service_role is the whole distinction. There will be no confirmed-live state. Establishing that a key still works means using someone's credential against their account, which is not a thing this study will do to 1,969 people to sharpen a percentage. The cost is that this measures prevalence and not blast radius, which is why that limit is written here rather than left for a reader to find.
The three notes above exist because of a reader challenge in r/vibecoding, made publicly and used with permission: https://www.reddit.com/r/vibecoding/comments/1vlqtig/comment/p34xgoe/. The correction it prompted is recorded rather than quietly absorbed, on the same principle as the wildcard-CORS withdrawal in the 549-repo study.
how this compares to AI-coded apps generally
The same engine over 549 repositories that merely describe themselves as AI-coded found 20.4% with an exposed-secret finding. The two populations are close on secrets and the Lovable set is worse on committed .env files specifically. The tooling generates a working application in one step, and a working application needs keys that land in a file.
The state of vibe-coded app security (549 repos) →download the raw data
The verification rows include every verdict, the ones that went against us included: which rule fired, what the reviewer decided, and how sure it was. Repository names are replaced with sequential ids. Every figure on this page recomputes from the rows below; what the rows will not give you is which named app holds which credential, because publishing that would be a disclosure rather than a dataset.
free, no signup. one ask before the links: cite this page.