What Medicare Advantage plans file for agent pay (9 years, 40,657 filings)
Based on 40,657 plan-year filings · published 1 August 2026 · by O Grover, founder, ogbuilds
the numbers
| figure | what it measures |
|---|---|
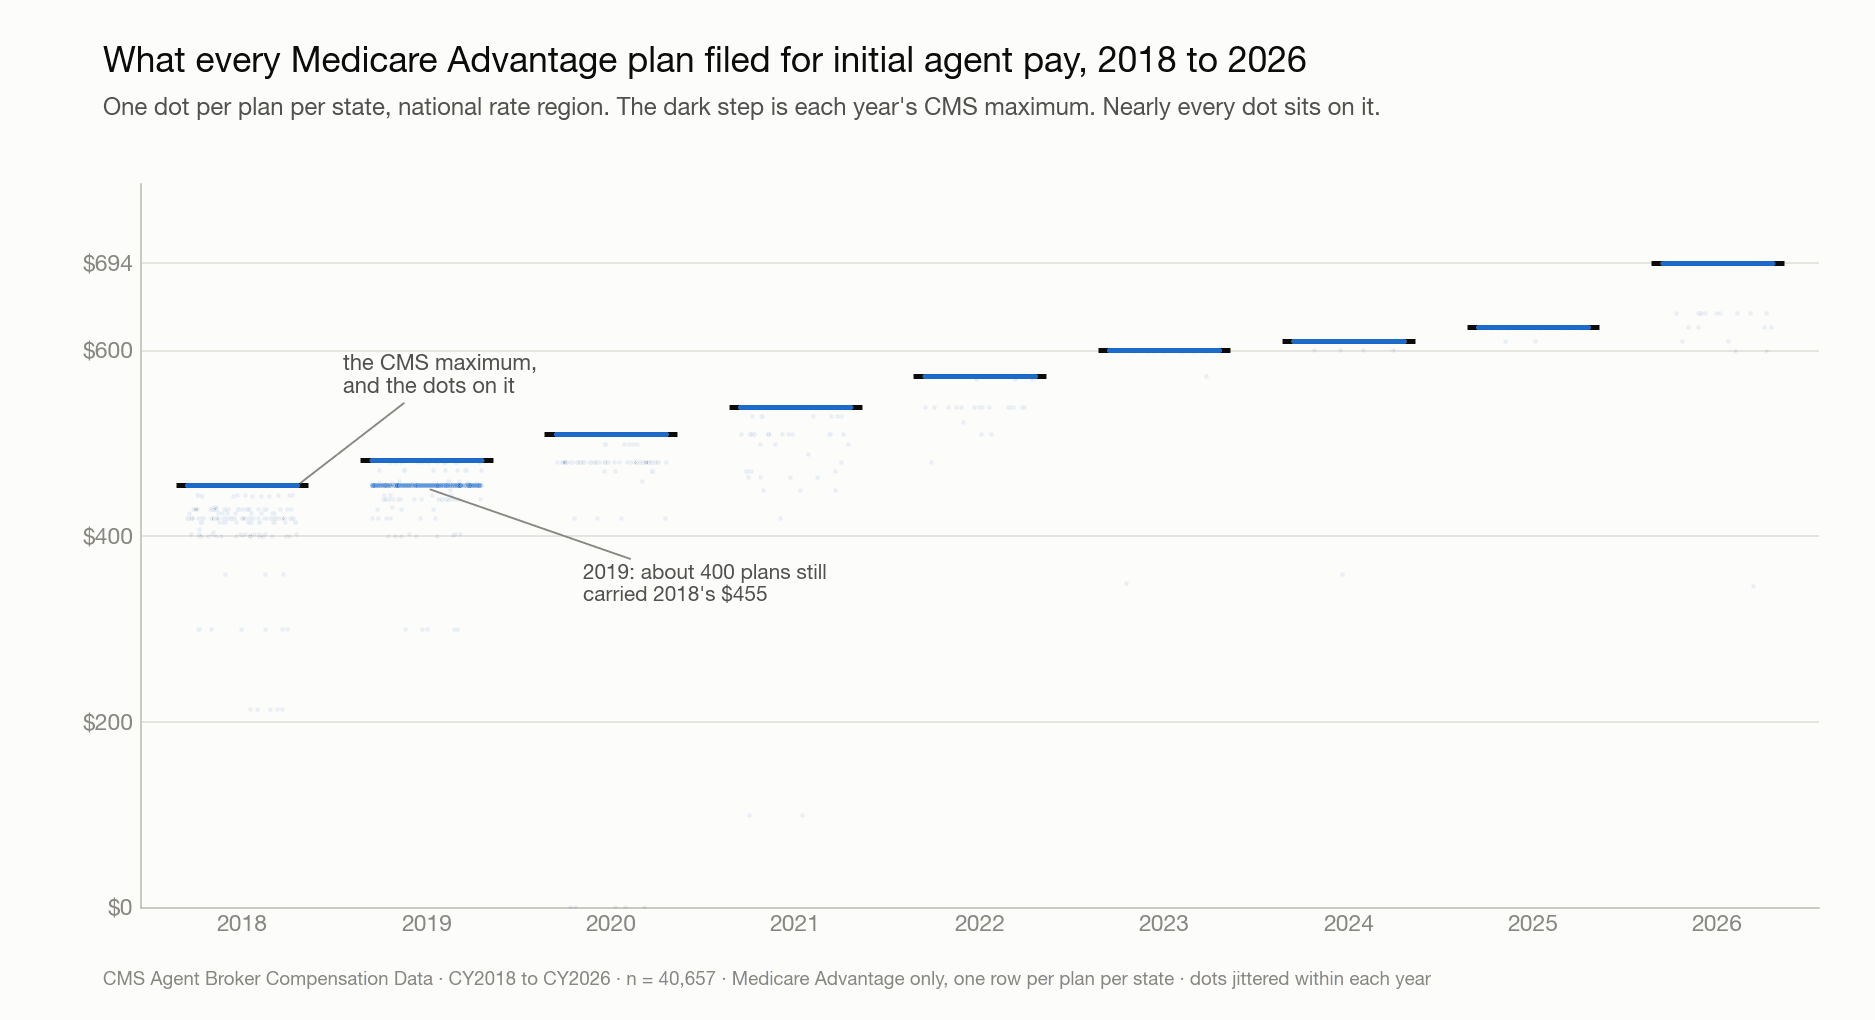
| 99.6% | of CY2026 Medicare Advantage plans file agent pay at exactly the CMS maximum of $694. The ceiling is the going rate, not a limit anyone stops short of |
| 95.6% | file a minimum of $0, so the attested range is $0 to $694 and the public record can't tell an agent what they're owed |
| 28.5M | of the 29.8M enrollees matched to a filing are in a plan whose filed floor is $0, including every Humana, CVS, Elevance and Kaiser member |
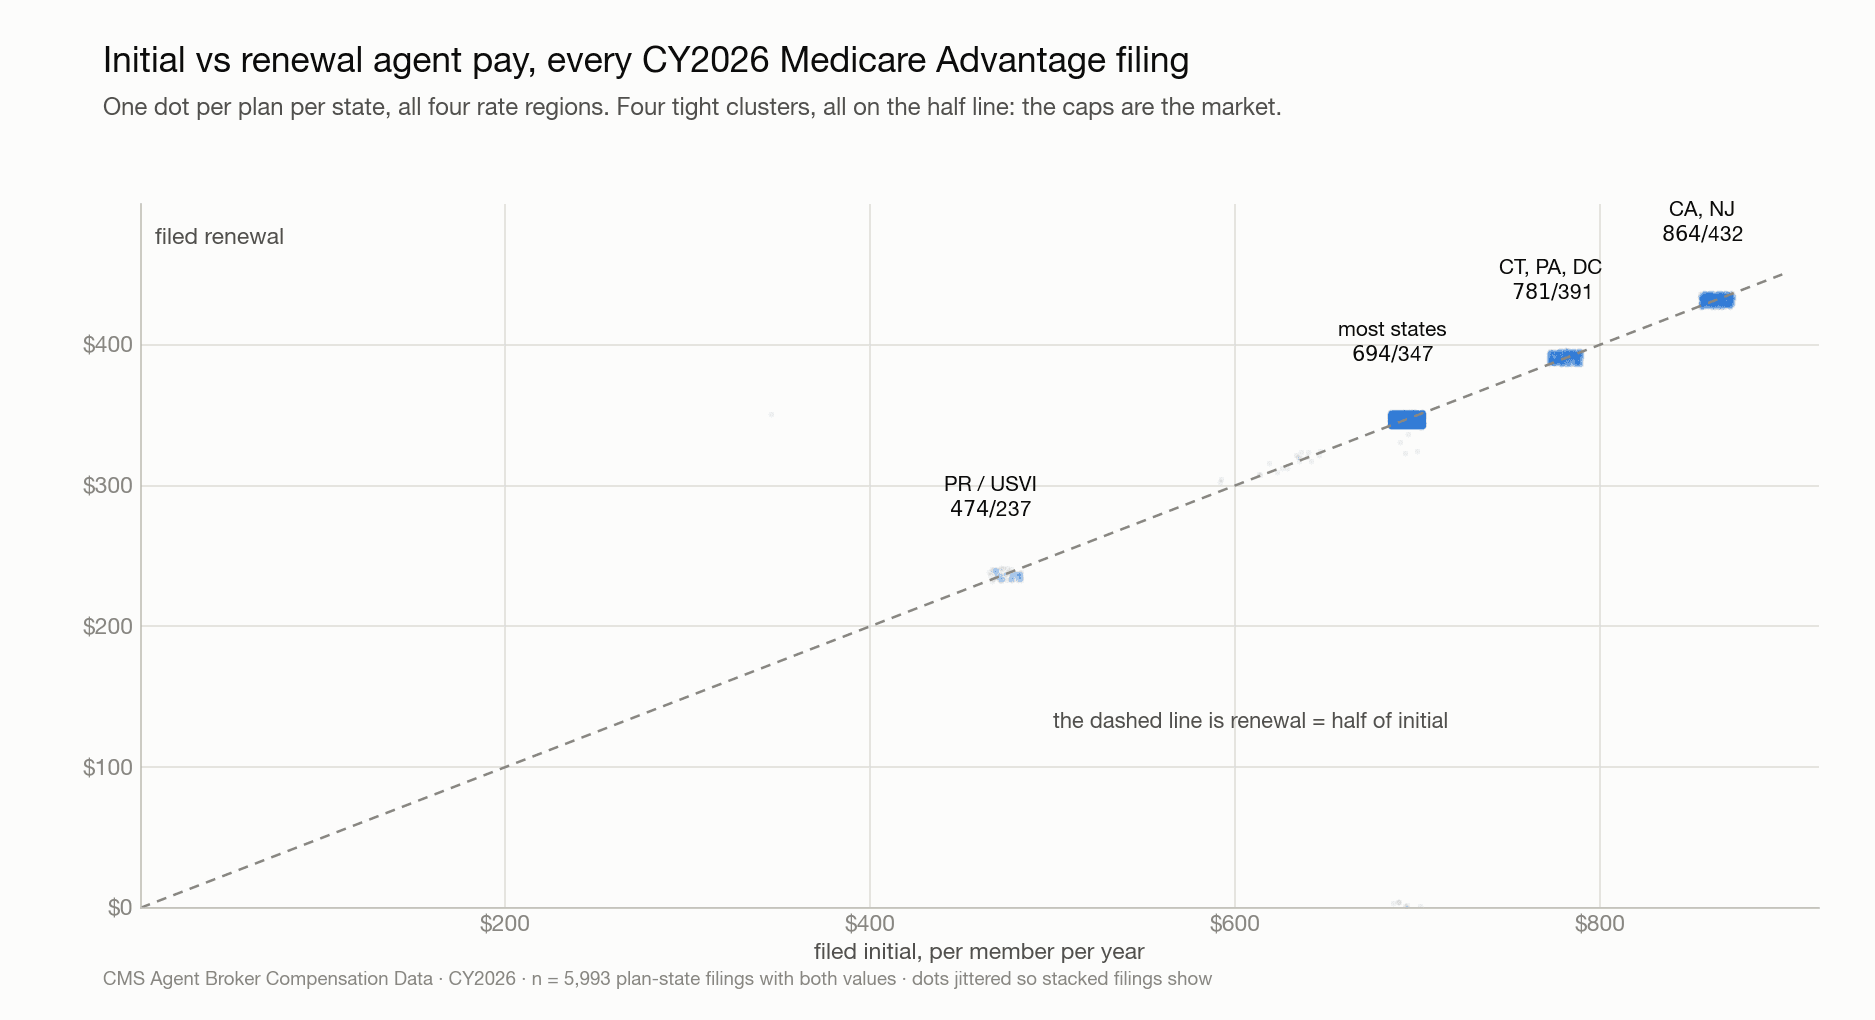
| 99.4% | of CY2026 plans set renewal at exactly half of initial, $347 on $694. Filed as half rounded to the dollar, it never falls below 98% in nine years |
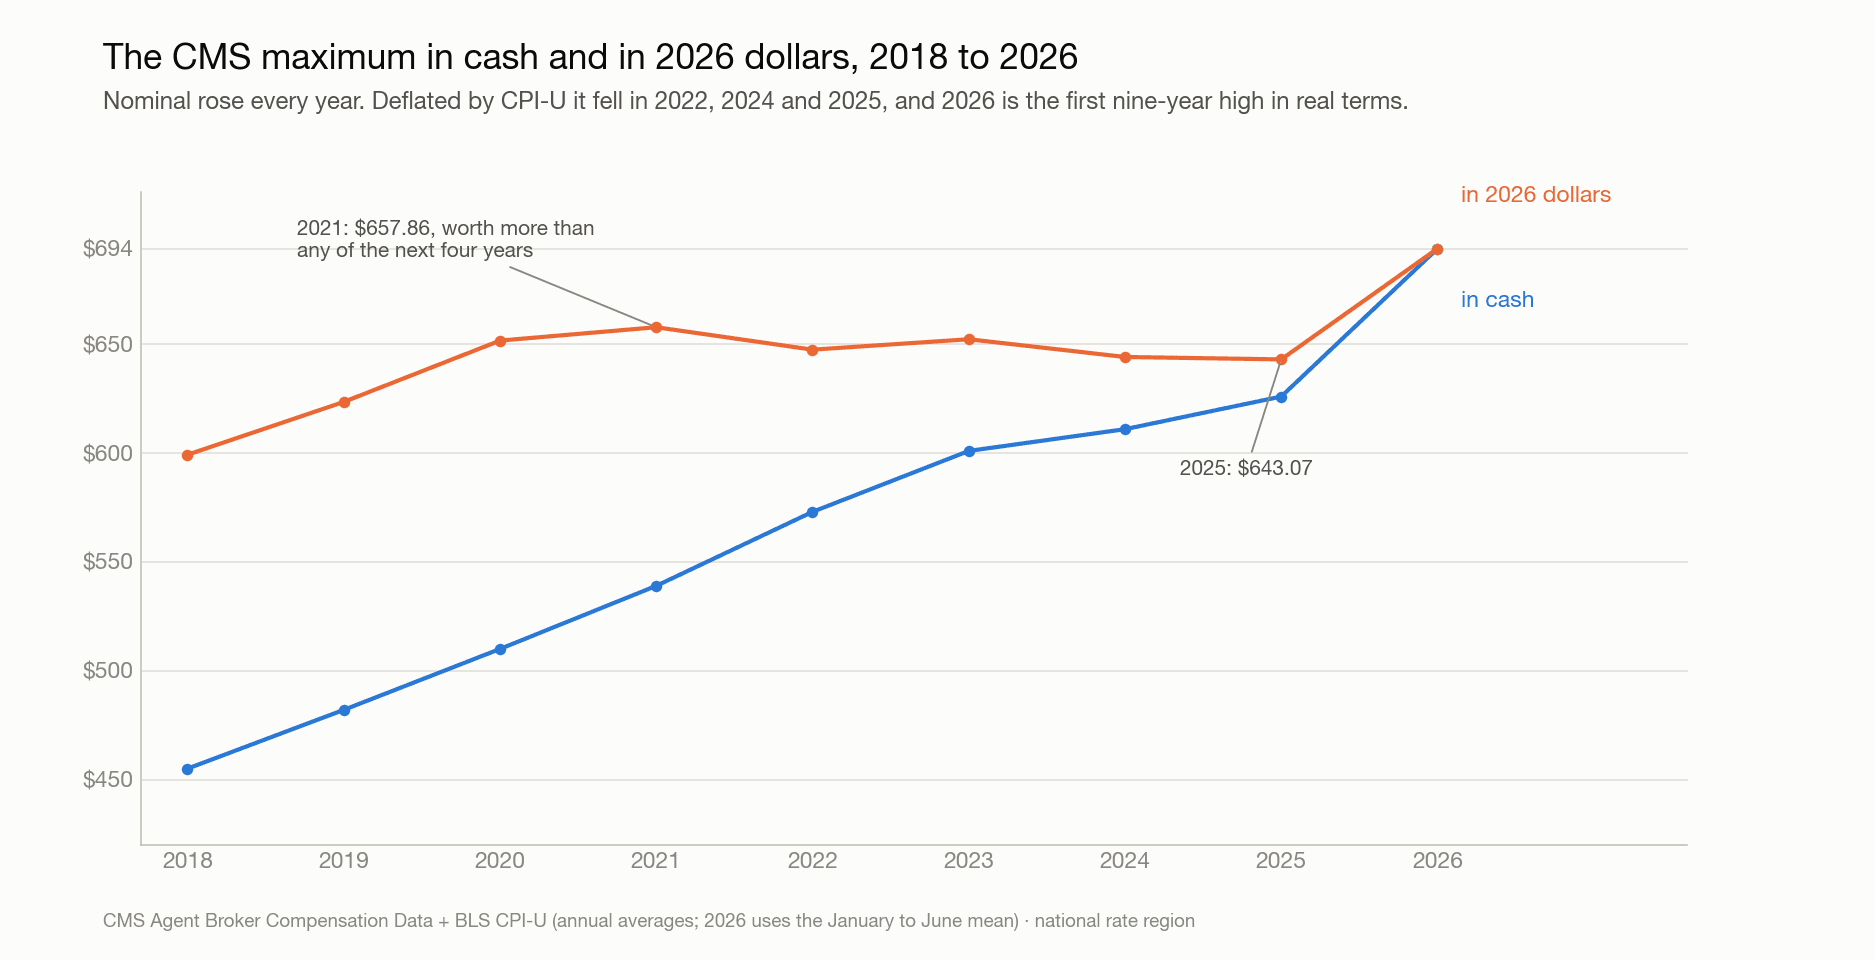
| −2.2% | real-terms change in the maximum between 2021 and 2025, deflated by CPI-U. It lost ground to inflation in 2022, 2024 and 2025 before the 2026 correction |
The filings put every agent somewhere between $0 and the cap. Where you actually sit is only in your carrier portals. reportr reads them in your browser and flags what's short-paid.
the shape of the data
Charts are free to reuse with a link back to this page.
methodology
Every Medicare Advantage plan files the agent compensation it will pay, per county, and CMS publishes it. We read CY2018 through CY2026, deduped to one row per plan per state, and joined CY2026 to July 2026 enrollment so plans count for the people in them. Each year's regulatory maximum is recovered from the filings and checked against the published CMS memo.
A filing is not a payment. This is what carriers attest they will pay agents. What actually landed in an agent's account is published nowhere, which is the gap the whole study points at.
CMS never defines a $0 minimum, and none of the 5,056 national-rate filings leaves the field blank. The likeliest innocent reading is operational: initial pay is pro-rated by month and clawed back entirely on a rapid disenrollment, so a $0 floor can be a carrier stating its worst case net of chargebacks. A few plans file floors of $57.83, one month of $694, and 181 file a floor equal to their ceiling. The share filing zero jumped from 86.6% to 95.6% in the year CMS changed its file format, so the direction is firmer than the level.
Each year's maximum is derived from the filings rather than transcribed, then checked against the published CMS memos for 2021, 2025 and 2026 across all four rate regions. Twelve comparisons, twelve exact matches, and the build refuses to write output if any of them drift.
Standalone drug plans are excluded, since they run on a schedule near $100 rather than $700. Rows dedupe to one per plan per state so a plan sold in 600 counties doesn't outvote one sold in three. CMS suppresses enrollment cells of ten or fewer, so the weighted totals under-count small rural plans.
download the raw data
The source filings are CMS's, free and public. Below: our derived figures, plus the CMS page that serves every year's compensation ZIP.
free, no signup. one ask before the links: cite this page.